Selected Work / Two Ledgers
Two Ledgers
What a company said, what its records showed — a demonstrative system for a fictional securities class action.
Independent speculative study · Speculative R&D · 2026
Role
Litigation designer & information strategist
Scope
Evidence architecture, 12-exhibit demonstrative system, courtroom builds
Outcome
A complete visual system for a document-heavy financial trial
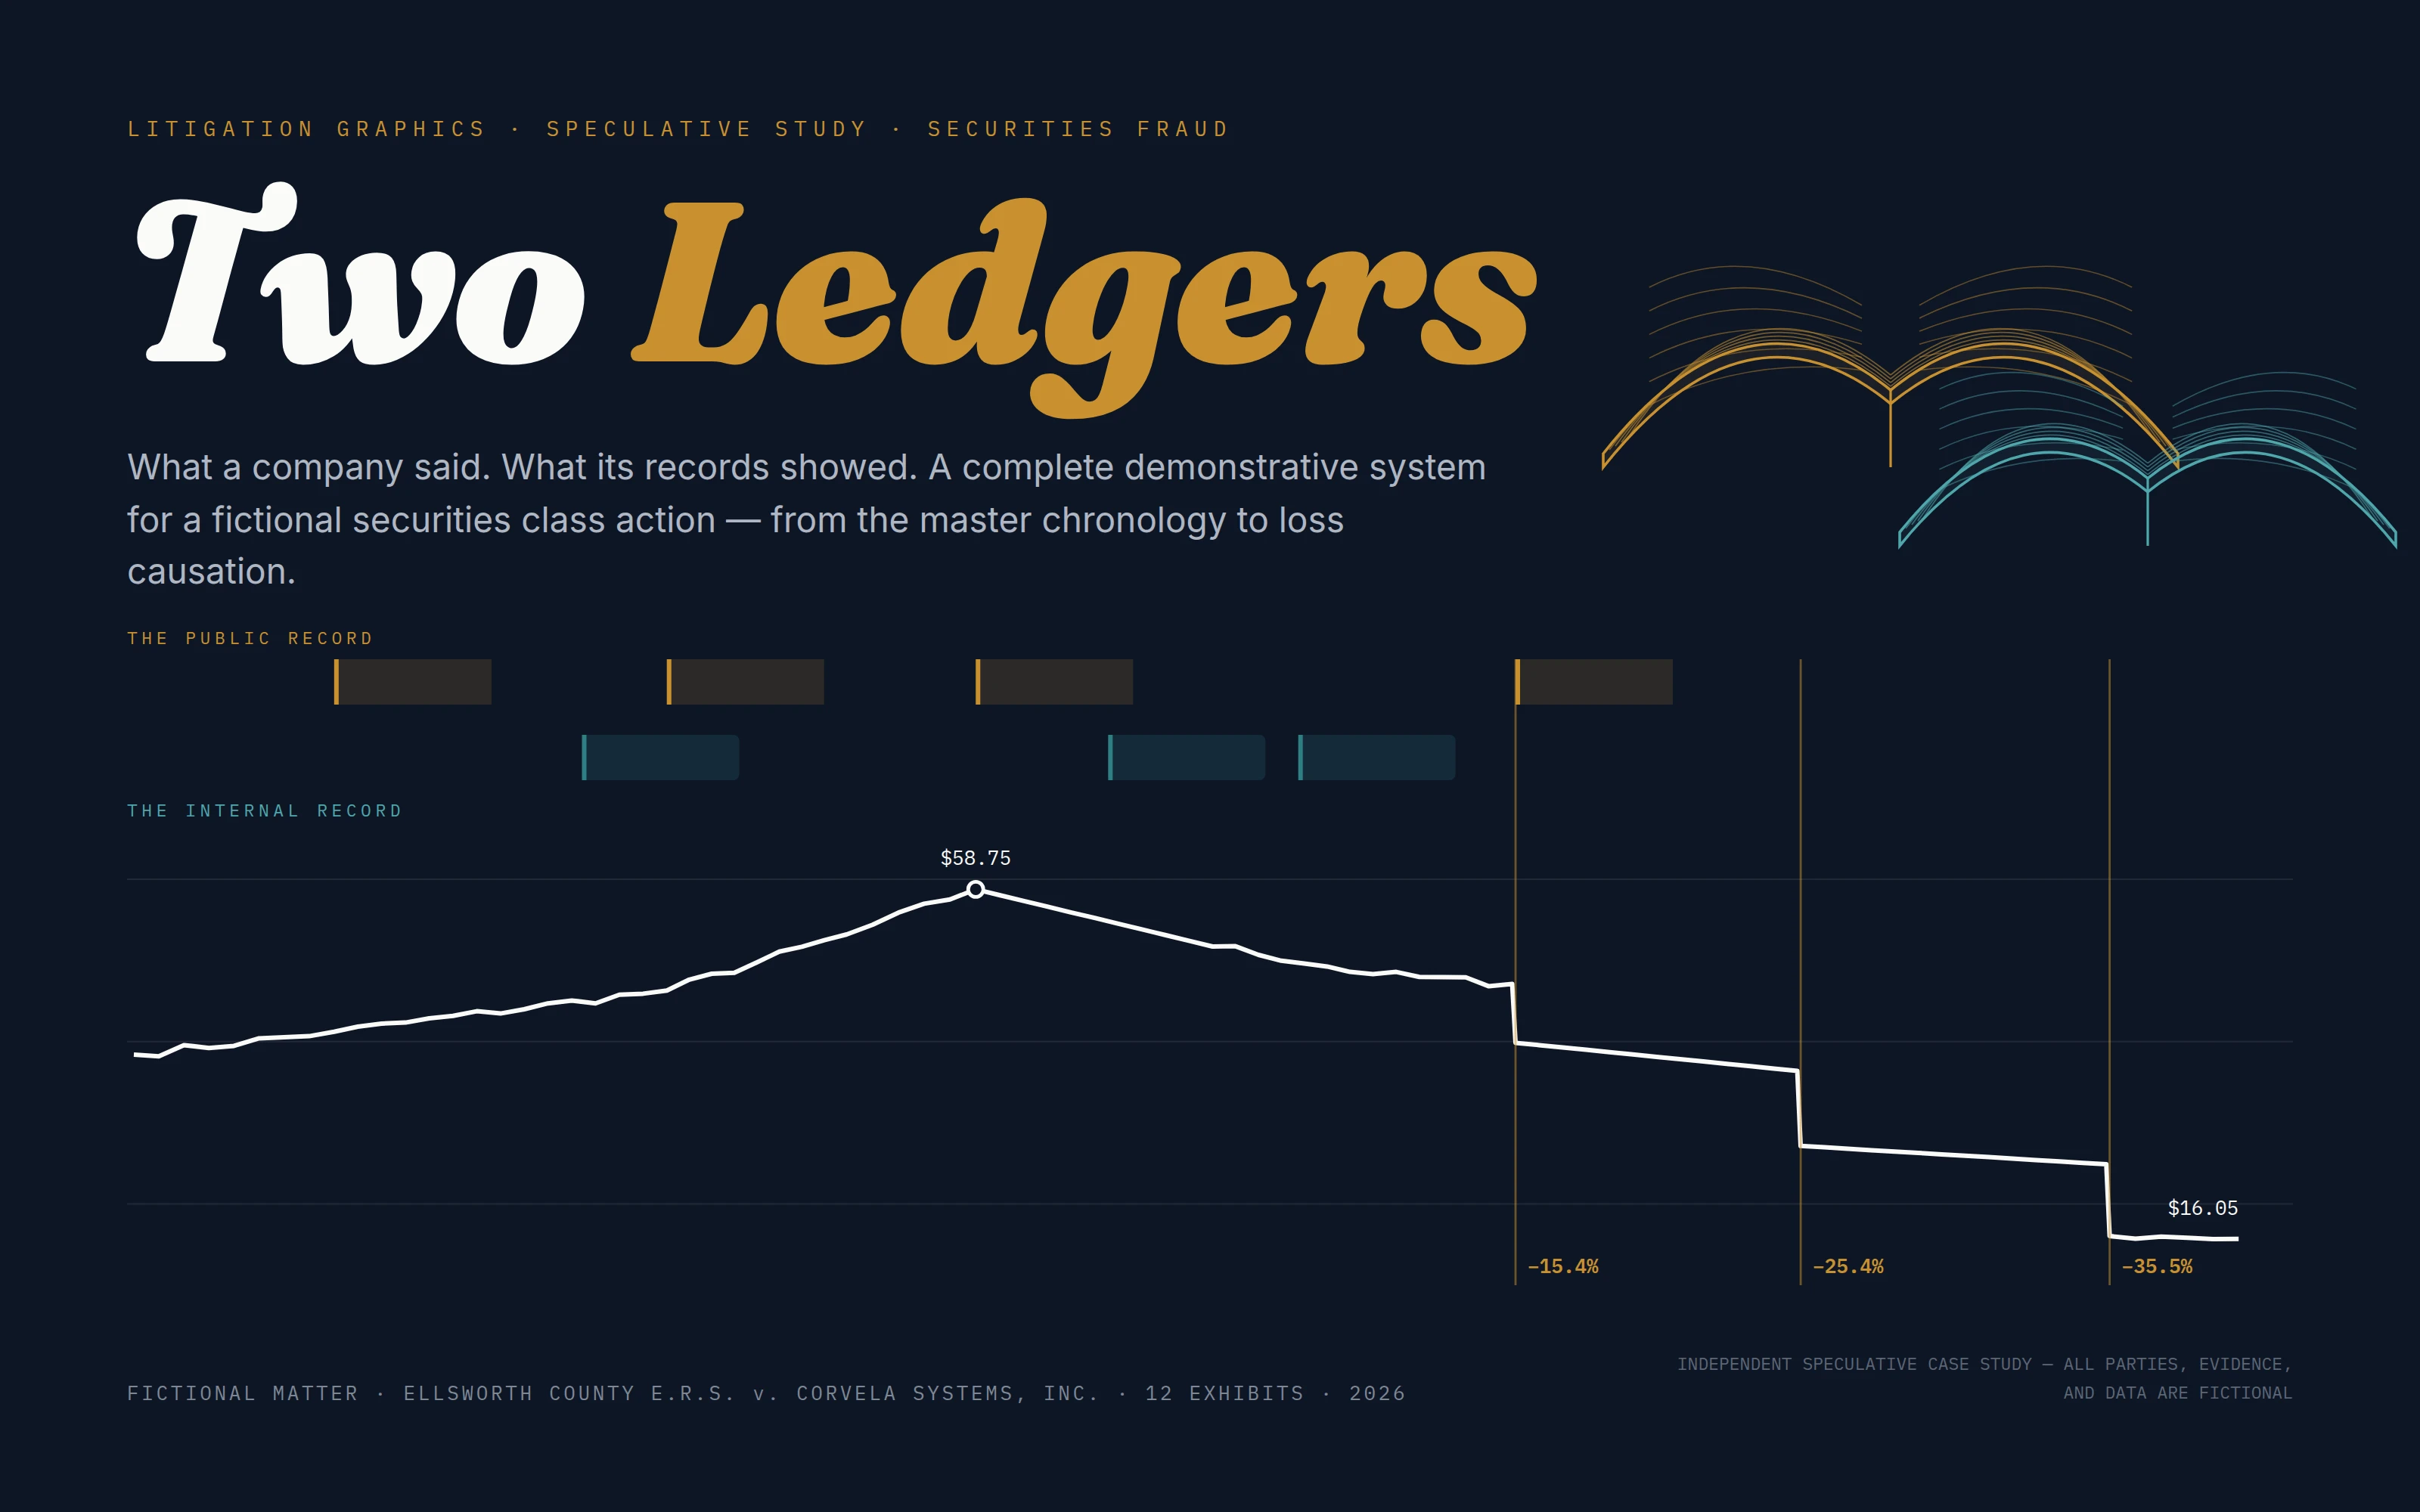
The two ledgers — master chronology
Said / showed — four pairs, one spine
Anatomy of a reported number
Subtract the market — loss causation
The corroboration grid
Challenge
Securities cases have no wreckage to photograph. The entire dispute lives in documents describing numbers: six quarters of retention metrics, an internal dashboard, three disclosure events, a falling stock in a falling market. The fact-finder must hold two versions of the same company in mind at once — and must never be allowed to confuse “the stock dropped” with “the fraud did it,” because the moment a graphic overclaims causation, the whole presentation loses the room.
Opportunity
The evidence had a hidden symmetry: for every public statement there existed a dated internal document, and the internal date always came first. That symmetry is the case. Design it once — amber for what was said, teal for what the records showed, grey for the market — and every exhibit becomes a view of the same instrument.
Strategy
Teach before arguing. The sequence of understanding runs: how a subscription business works; what investors were told; what the dashboard showed on the same dates; how the reported number was assembled; what it cost when the truth emerged. Four propositions, each corroborated by at least three evidence types — and the defense’s strongest chart (the whole sector fell) drawn fairly inside our own system, then answered with the event-study residual rather than shouted over.
Process
Built the fictional record first: eighteen months of daily prices, six quarters of paired metrics, fourteen dated exhibits, all cross-checked so every number in every panel reconciles. Then designed the master chronology and derived the other eleven demonstratives from it, testing each against the objections it would draw.
Creative Direction
A forensic-ledger aesthetic: ruled paper, tabular numerals, typographic document chips, two semantic inks and a market grey. No arrows implying causation; no red and green; one idea per exhibit; every mark cited. The restraint is the persuasion.
Outcome
As a speculative system, the study demonstrates end-to-end capability: a coherent twelve-exhibit architecture, five panels developed to production detail, and a design language a trial team could extend to hundreds of exhibits without losing coherence. No verdict is claimed — the deliverable is the communication system itself.
Lessons learned
In financial litigation the decisive graphic is rarely the dramatic one; it is the one that concedes the opponent’s chart and still stands. Subtract the market, keep the dates honest, and let alignment do the arguing.
Disclosure
Independent speculative case study. All parties, evidence, and data are fictional and were created solely to demonstrate litigation-graphics strategy.
Next case study
432 Days →